Living Better
Direction: Retreating
Risk: High
Pace: Lagging
This pillar is about drivers that boost living standards.
The aim is to promote policies and practices that will lead to better lives for all of us.
To gauge progress on this front, we monitor eight indicators—from how quickly incomes are growing to the share of women in senior management positions.
The results show not only that we remain far from our targets, but that our progress is stalled and in some cases deteriorating.
Growth at a glance
Aspirational targets have been set across the three pillars to attain long term, inclusive and sustainable growth.
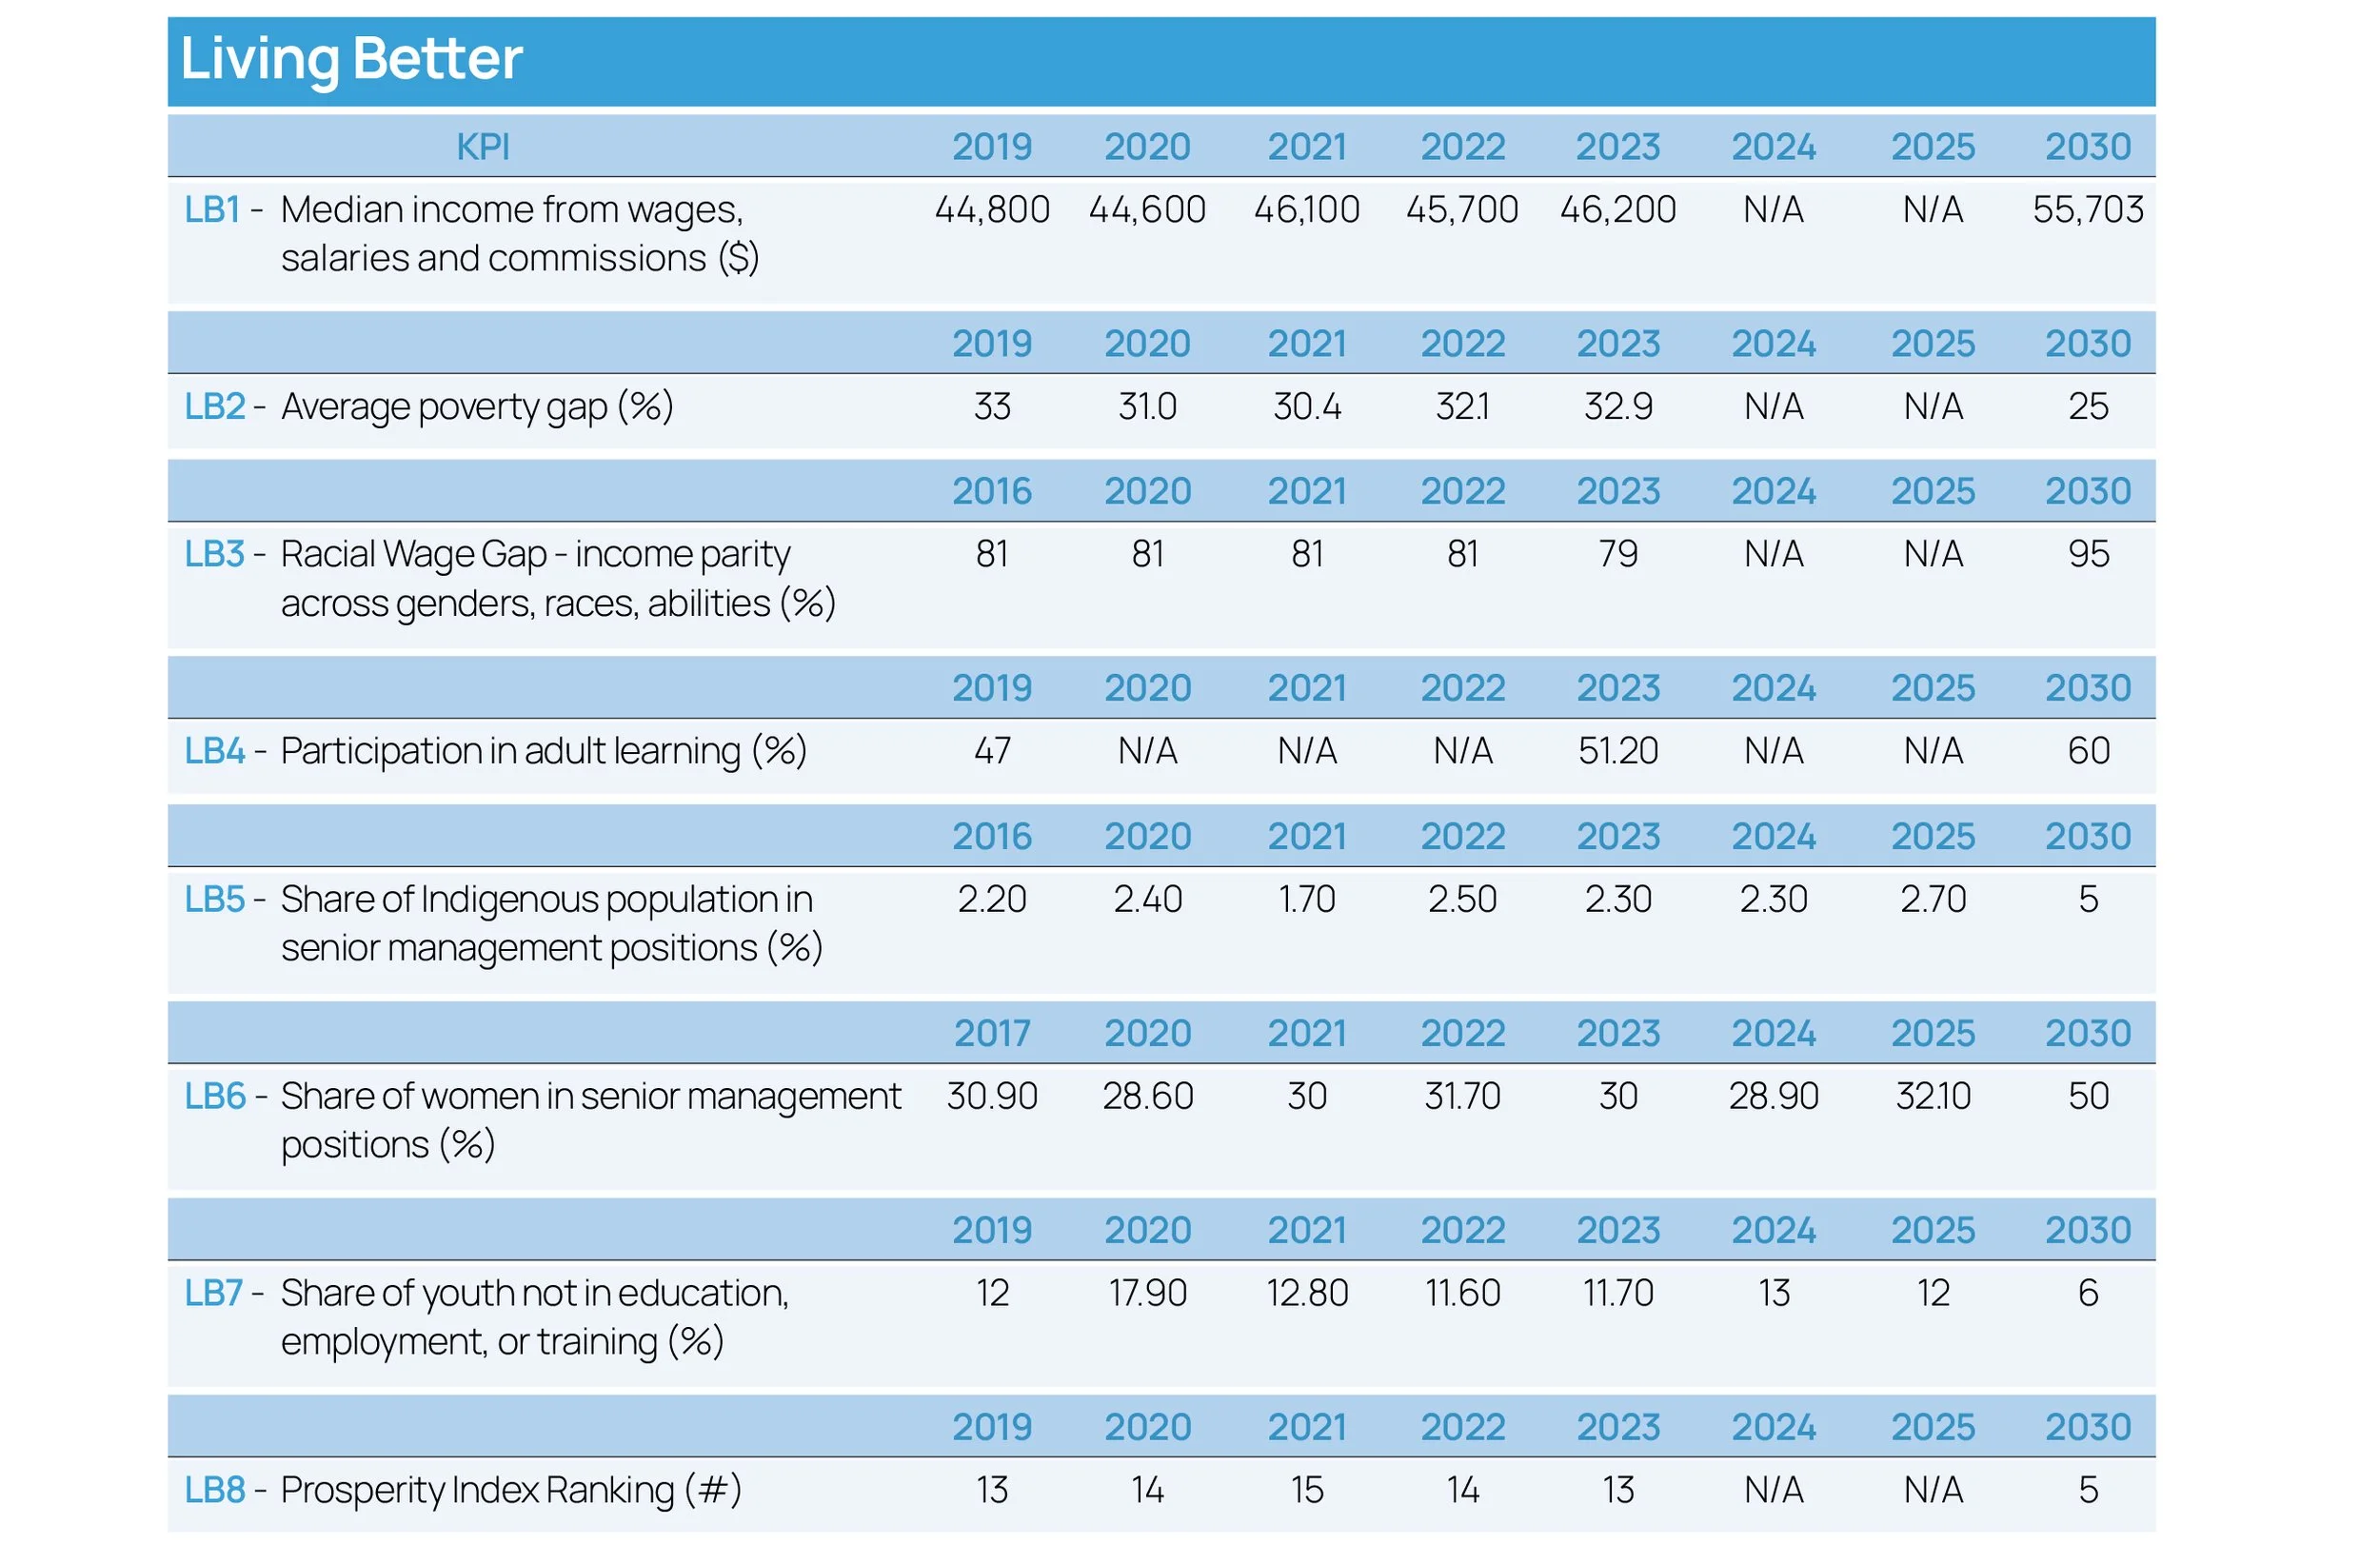
Prosperity Index Ranking (#)
The Prosperity Institute is updating how it conducts the Legatum Prosperity Index and will release updated data later in 2026.
The Atlantic Council Prosperity Index has reported that in 2024 Canada dropped to 20th on the Prosperity Index ranking. Please note that the Atlantic Council work is not directly related to our current report.
Source: Legatum Institute
Living Standards
Median income from wages, salaries and commissions ($)
The most effective force for raising per capita income is productivity—the efficiency with which labour and capital are deployed. However, Canadian living standards are currently caught in a vice of stagnant productivity and rising costs.
While real GDP per capita saw a slight 0.5% uptick in late 2025, the underlying trend remains weak.
A decade-long shift toward less productive, domestic-facing sectors has caused capital per worker to decline, undermining real wages and long-term prosperity.
Average poverty gap (%)
Poverty rates reflect this strain. After a pandemic-era low of 6.4%, the national poverty rate has climbed back to 10.9%, with “deep poverty” affecting 5.5% of families. Food insecurity now affects nearly one in five Canadians. Households are facing a massive squeeze: since 2010, nondiscretionary spending and taxation have each consumed an additional 3% of household income.
Consequently, discretionary spending—the primary driver of quality of life—shrank to just 14% of income in 2024, down from 20% in 2010.
While headline inflation has cooled, essential costs remain punitive. Food prices rose 4.7% year-over-year in late 2025—double the general inflation rate—and are projected to climb another 4-6% in 2026. Despite lower borrowing costs following 2025 rate cuts, household debt remains at a staggering 177% of disposable income.
Racial wage gap (%)
The earnings gap varies by racialized group. After holding steady through the pandemic, the racial wage gap has widened. In 2023, racialized Canadians earned 79 cents for every dollar that nonracialized Canadians earned.
Human Capital
Participation in adult learning (%)
In 2023, 51.2% of adults in Canada participated in adult learning, up 4.2% since 2019, but this rate was 6.6 percentage points lower than Norway’s.
Participation in adult learning, as measured by the Survey of Adult Skills (PIAAC), was last updated in 2019, with the 2023 release representing the most recent data.
Share of Indigenous population in senior management positions (%)
Since 2017, women have consistently held a share in legislative and senior management positions that is approximately 2 to 2.5 times smaller than that of men.
The picture for women is mixed. According to Statistics Canada’s labour force survey data, the share of women in all management jobs rose slightly in 2025, hitting 32.1 per cent.
Share of women in senior management positions (%)
Inclusivity is not just a social goal; it is an economic necessity for innovation. Yet wealth inequality is rising, and systemic gaps persist. The labour market for Indigenous people has shown some improvement in representation due to economic development programs, but the jobless rate remains around 10%—more than three points higher than the national average. The share of Indigenous people in management positions is stuck at 2.7%, about half of our 2030 goal. The share of women in senior management reversed its years-long decline, rising to 32.1%, but is still well short of the Coalition’s 50% target. Racialized employees earn 79 cents for every dollar earned by non-racialized workers.
Meaningful progress requires integrating Indigenous communities into the national “Build Agenda.” The Haisla Nation’s Cedar LNG project—the world’s first Indigenous-majority-owned LNG facility—marks a transition from federal transfer dependence to global commercial autonomy. “By allowing First Nations to really be involved in a lot of these economic development projects, we’re going to increase our GDP and our contribution to Canada,” said Ernie Daniels, president and CEO at the First Nations Finance Authority.
Share of youth not in education, employment, or training (%)
Young Canadians are showing signs of severe distress. The “NEET” rate (those not in employment, education, or training) rose to 12% in 2024, with regional spikes as high as 41% in Nunavut. Youth unemployment hit 14.7% in late 2025, the highest since 2010 outside of the pandemic. Young people represent 28% of all unemployment despite making up only 14% of the labour force.
Preparing this workforce requires a reversal in educational declines. Mathematics education plays a critical role in driving a country’s longterm economic growth, primarily through its impact on cognitive skills development. Yet the OECD’s Programme for International Student Assessment (PISA) scores show a consistent decline in reading, science, and—most sharply—mathematics since the early 2000s. In smaller provinces, the math decline is equivalent to losing 2.5 years of schooling since 2003.
Without significant investment in education and productive sectors, Canada cannot achieve its equity goals. We cannot share prosperity that we aren’t creating. At the same time, we must prioritize investments that future-proof entry-level jobs for young Canadians, ensuring they gain the skills and employment needed to remain resilient in the face of rapid advances in AI and automation.
Related Insights